
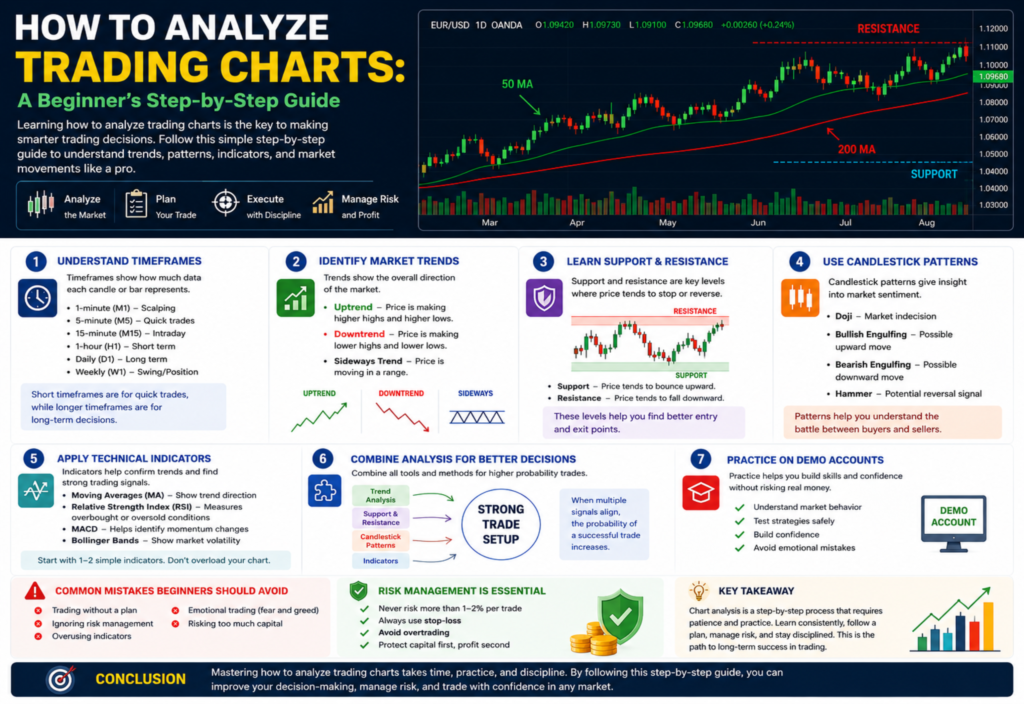
Learning how to analyze trading charts is one of the most important skills for anyone starting in financial markets. Whether you are trading forex, stocks, or cryptocurrencies, charts help you understand price movements, market trends, and possible future direction.
For beginners, chart analysis may look complicated at first. However, once you understand the basics, it becomes much easier to read market behavior and make better trading decisions. This guide will explain trading chart analysis step by step in a simple and practical way.
What Are Trading Charts?
Trading charts are visual representations of price movements over time. They show how the price of an asset moves up or down in a specific period.
The most commonly used chart types include:
- Line charts – Simple view of price movement over time
- Bar charts – Show open, high, low, and close prices
- Candlestick charts – Most popular among traders for detailed analysis
Candlestick charts are widely used because they provide more information in a single view and help traders understand market psychology.
Step 1: Understand Timeframes
Timeframes are the foundation of chart analysis. They show how much data each candle or bar represents.
Common timeframes include:
- 1-minute (M1)
- 5-minute (M5)
- 15-minute (M15)
- 1-hour (H1)
- Daily (D1)
- Weekly (W1)
Short timeframes are used for quick trades, while longer timeframes are used for long-term decisions. Beginners should start with higher timeframes like H1 or D1 to avoid confusion.
Step 2: Identify Market Trends
The next step in chart analysis is understanding the trend.
There are three main types of trends:
- Uptrend – Price is moving higher
- Downtrend – Price is moving lower
- Sideways trend – Price is moving in a range
A simple way to identify trends is by observing higher highs and higher lows in an uptrend or lower highs and lower lows in a downtrend.
Step 3: Learn Support and Resistance
Support and resistance levels are key areas where price tends to stop or reverse.
- Support – A price level where the market tends to bounce upward
- Resistance – A price level where the market tends to fall downward
These levels help traders decide when to enter or exit trades.
Understanding support and resistance is essential for building strong trading strategies.
Step 4: Use Candlestick Patterns
Candlestick patterns give insight into market sentiment. Each candlestick shows:
- Opening price
- Closing price
- Highest price
- Lowest price
Some common patterns include:
- Doji (market indecision)
- Bullish engulfing (possible upward movement)
- Bearish engulfing (possible downward movement)
- Hammer (potential reversal signal)
These patterns help traders predict possible market direction.
Step 5: Apply Technical Indicators
Technical indicators are tools that help confirm market trends and signals.
Popular indicators include:
- Moving Averages (MA) – Show trend direction
- Relative Strength Index (RSI) – Measures overbought or oversold conditions
- MACD – Helps identify momentum changes
- Bollinger Bands – Show market volatility
Beginners should not overload charts with indicators. Start with 1–2 simple tools first.
Step 6: Combine Analysis for Better Decisions
Successful trading is not based on one signal. You should combine:
- Trend analysis
- Support and resistance
- Candlestick patterns
- Indicators
When multiple signals align, the probability of a successful trade increases.
Step 7: Practice on Demo Accounts
Before using real money, practice on a demo account. This helps you:
- Understand market behavior
- Test strategies safely
- Build confidence
- Avoid emotional trading mistakes
Practice is very important in trading success.
Common Mistakes Beginners Should Avoid
Many beginners lose money because of simple mistakes such as:
- Trading without a plan
- Ignoring risk management
- Overusing indicators
- Emotional trading (fear and greed)
- Risking too much capital
Avoiding these mistakes can significantly improve your trading performance.
Risk Management is Essential
No matter how good your analysis is, risk management is key.
Basic rules include:
- Never risk more than 1–2% per trade
- Always use stop-loss
- Avoid overtrading
- Protect capital first, profit second
Good traders focus on survival, not just profits.
Conclusion
Learning how to analyze trading charts is a step-by-step process that requires patience and practice. By understanding timeframes, trends, support and resistance, candlestick patterns, and indicators, beginners can build a strong foundation in trading.
Remember, success in trading does not come overnight. Consistent learning, practice, and discipline are the keys to long-term growth in financial markets.